
Authors:
Susan Neuhaus
Rating:
0/5
Body:
Spreadsheets may seem like the exclusive domain of accountants and other number crunchers, but they can make life easier for designers too. Im using Google Drive spreadsheets in the examples below. You can create and store them for free with a Google account.
[h=2]Spreadsheets 101[/h] Before we dive in, lets review a few spreadsheet basics for absolute beginngers. When you open a spreadsheet, you see a grid of boxes that are called cells. Each cell contains a bit of information. The cells are arranged horizontally in rows which are numbered, and vertically in columns, which are indicated by letters. If youve ever worked on an HTML table or made a chart or graph you get the idea. Most spreadsheets can have multiple pages of these grids, called sheets The first row of a spreadsheet often has labels, and is then called the header row. A group of cells is called a range.
Each cell has an address made up of the column letter and the row number ie: G12. The cells can contain words or numbers in various styles such as time or date, currency, and percentage. Cells can also contain formulas. The formulas use numbers or the data in other cells to add, subtract, average and more. In a formula, a cell is referred to by its address, such as G12. These cell formulas are visible in the formula bar, at the top of the screen under the menu bar. The answer to the formula is visible in the cell.
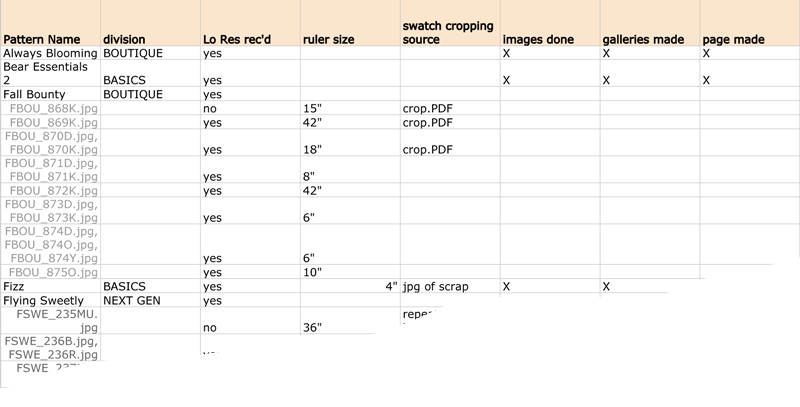
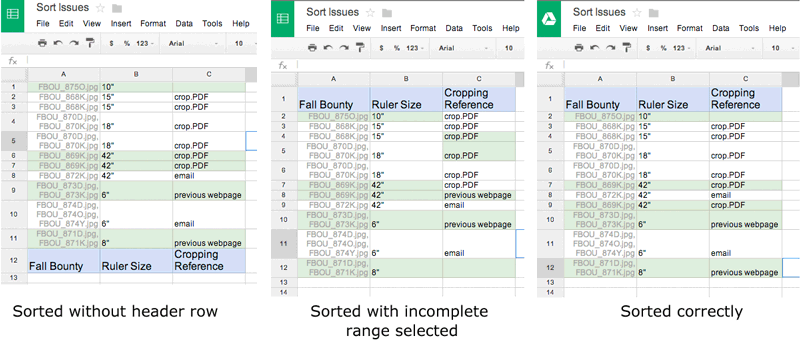
[h=2]1. Tracking Little Details in Big Jobs[/h] Looking at information in different ways by sorting data is one handy thing spreadsheets can do. You can use this to track progress on jobs and reorganize the information for different purposes. Recently my studio had to create images for a fabric website. We had to add the product ID and one of 15 different ruler graphics to a 100 or so jpg images of fabric patterns. To accomplish this, we needed to know several things: which fabric belonged with which collection; which ruler graphic should be applied; how to find the cropping reference; and where each fabric pattern was in our workflow. So I set up a spreadsheet like this:
We decided it was more efficient to do all the 10 ruler images at once. So I sorted the spreadsheet like this:
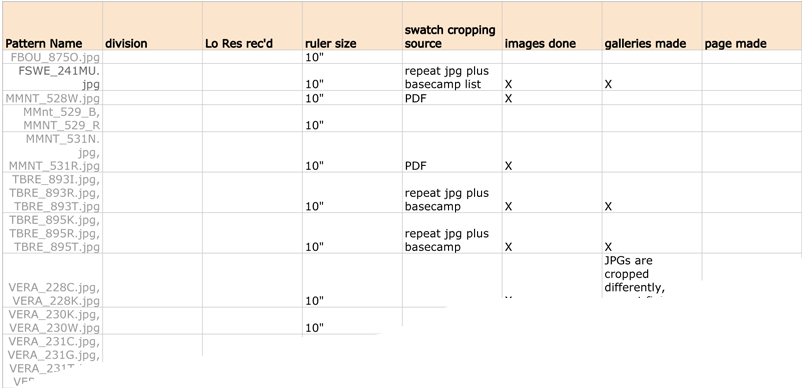
Now the production artist could see a continuous list of all the images that needed a 10 ruler graphic.
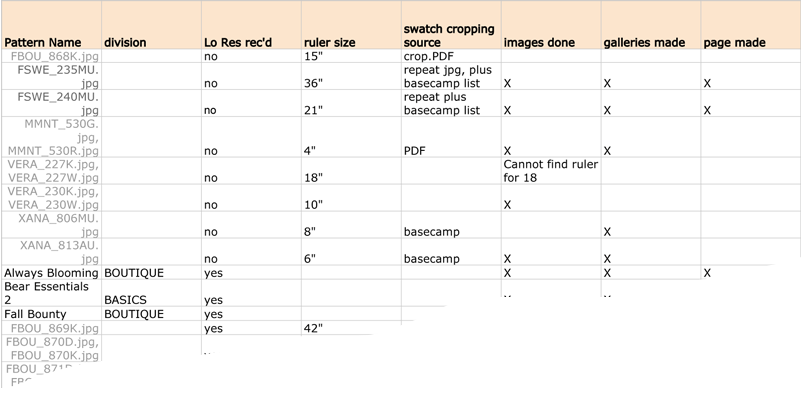
I could easily sort the data by workflow stage (Lo Res recd) so I could quickly copy and paste a list of lo-res images that I still needed and send it to the project manager:
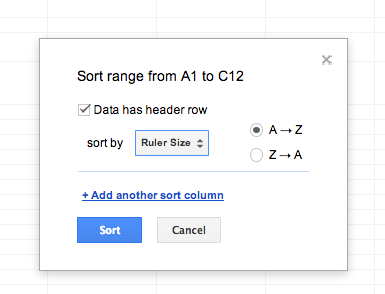
You sort the data in a spreadsheet by selecting all the cells you would like to sort, and selecting sort range from the data menu. Youll get a dialog box asking which column youd like to use to determine the sort, if the range you selected has a header row, and if youd like to sort from A to Z or Z to A. (Numbers will be sorted lowest to highest or vice versa).
Caution: Be careful when you select your data range for sorting! If, for example, you miss a couple of columns or rows when you select the range, your data could get out of order.
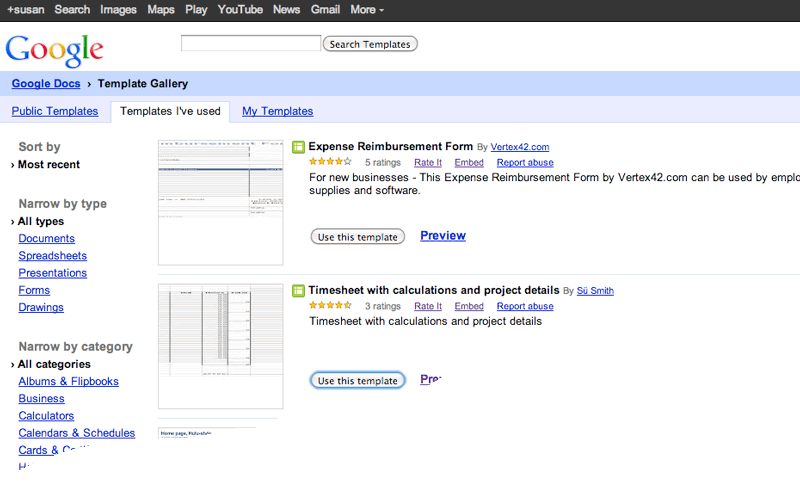
[h=1]2. Free Productivity-Boosting Forms[/h] You dont need to be an expert to use spreadsheets. Spreadsheet ninjas offer free pre-made spreadsheet templates for Google docs and Microsoft Excel. They range from personal finance calculators to calorie counters. There are useful ones for designers, including time tracking, web browser testing, and client forms.
When you see a form you like, select use this template.
Google will save it to a tab called Templates Ive Used so you can easily find it again when you search Google templates. You can also save a copy to your Google Drive.
You usually dont have to know how the formulas work to use them, although I find sometimes I need to make a fix. Spreadsheet formulas look different than the math I was taught in school, but its not rocket science.
1+1=2 would look like this in the formula bar:
=sum(1,1)
Youre instructing the cell to show you:
the answer(=) when you add (sum) one plus one (1,1)
Adding the contents of the cell at column B row 2 to the contents of the cell at column C row 2 would look like this in the formula bar:
=sum(B2,C2)
[h=1]3. Make Your Computer Figure it Out[/h] Spreadsheet formulas can do calculations for you, speeding up your work. For instance, when writing CSS for an ebook, I calculated percentages for a fluid multi-column div based on the pixel widths in the layout. Heres how I did it.
I made a place to input the numbers from the static layout in column B:
the width of the div in pixels (from the layout);
the number of columns;
and the gutter width in pixels (from the layout).
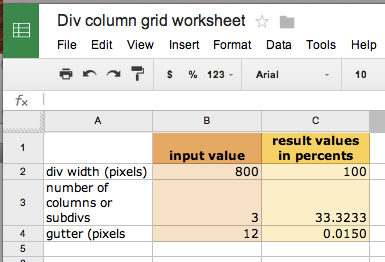
In C2, I put 100, because my whole div is 100%.
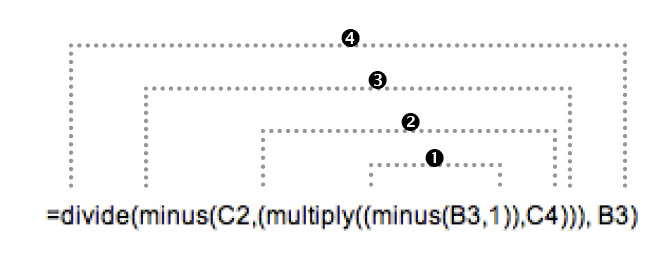
First, in cell C4, figure the widths of the gutters in percent by dividing the gutter width by the div width: =divide(B5,B3)
Then in cell E3, string several functions together by nesting them inside each other. Google spreadsheets will perform the inside functions first.
1. Figure out how many gutters there will be (The number of columns minus 1, or minus(B4,1))
2. Then multiply the number of gutters times the % width of the gutters,
3. Subtract the width of the gutters from the 100% and
4. Divide whats left by the number of columns to get the column width in percent.
Google also offers a good overview of adding formulas to spreadsheets.
[h=1]4. Keep Project Managers Happy with Pie (Charts)[/h] Spreadsheets can display data as charts and graphs, so for example, you could show hours spent on a job vs. the hours estimated.
Set up a spreadsheet with the parts of the job in rows, plus a header row with dates and total time spent. Include time remaining estimates if thats helpful.
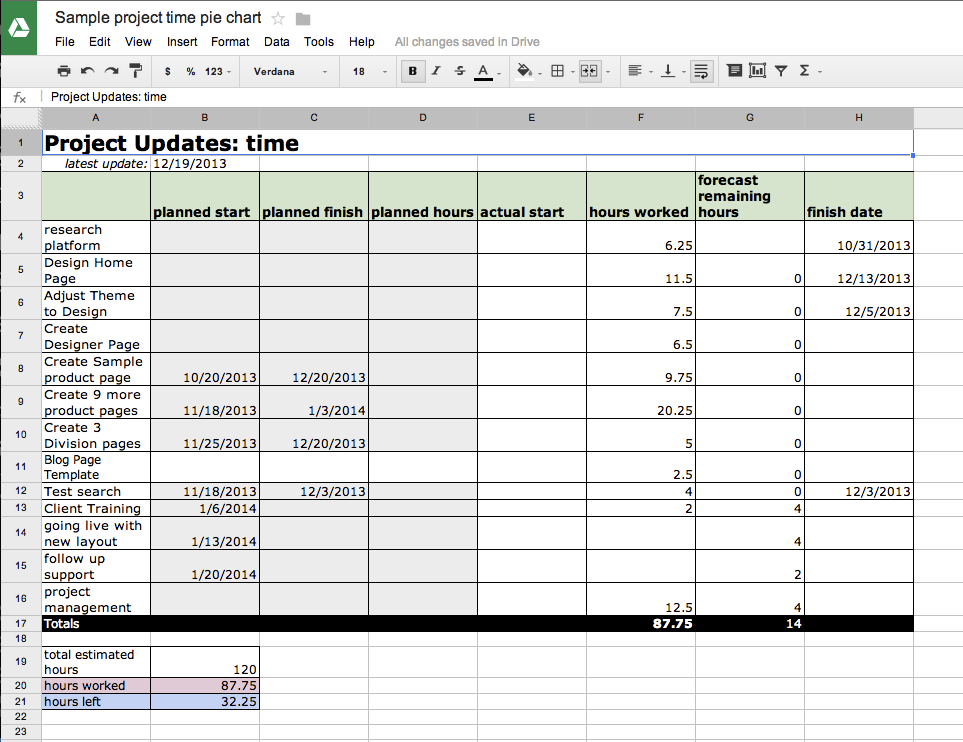
To get a total of hours spent, select the range of cells in the hours worked column, (in this case, from row 4 to row 16) and choose sum from the functions fly-out menu.
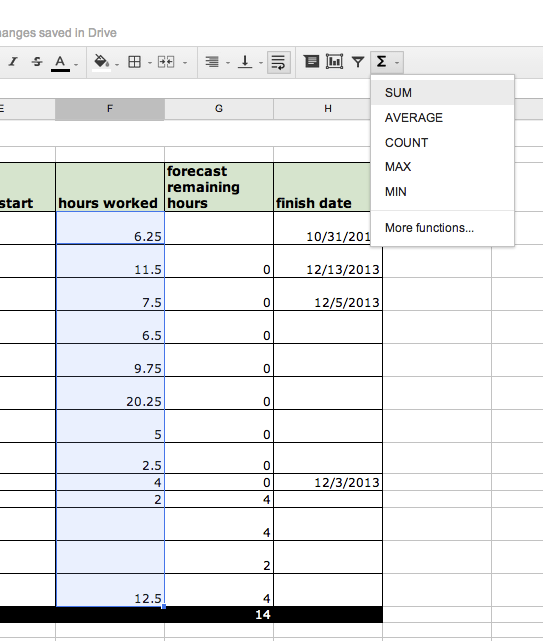
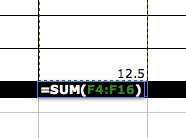
Notice that the formula has a colon instead of a comma between the two cell addresses. That means that the function (sum, or addition, is to be done to all the cells from F4 to F16)
You do the same for the forecast of remaining hours column.
Now, subtract the hours spent from your estimate:
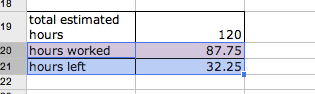
Put labels for your data in column A, rows 19 - 21
Put total estimate hours in cell B19
Put =(F17) in cell B20 to place your total hours worked there as well
Put this formula in cell 21B: =minus(B19,B20) to figure hours left
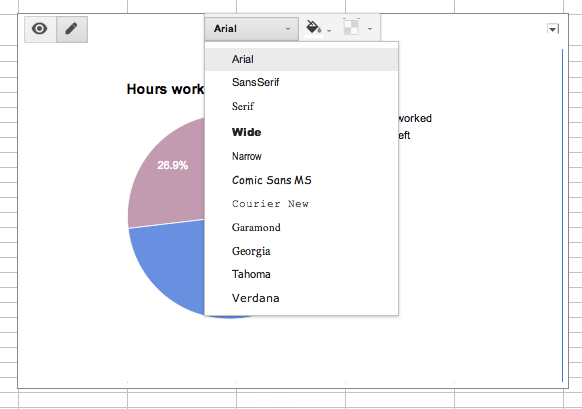
Select the range of cells from A20 diagonally across to B21. Choose Chart from the Insert menu. Choose pie chart from the dialog box.
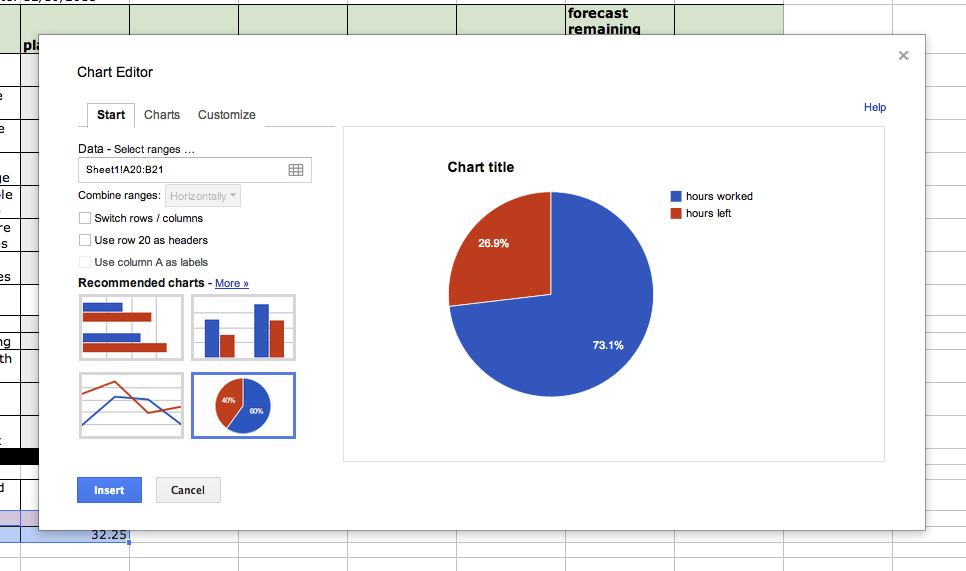
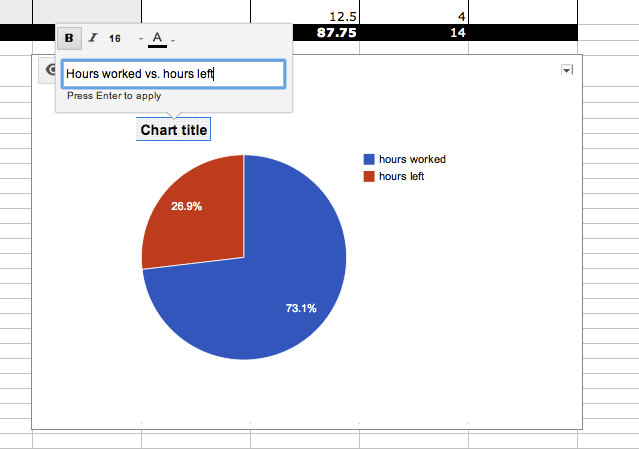
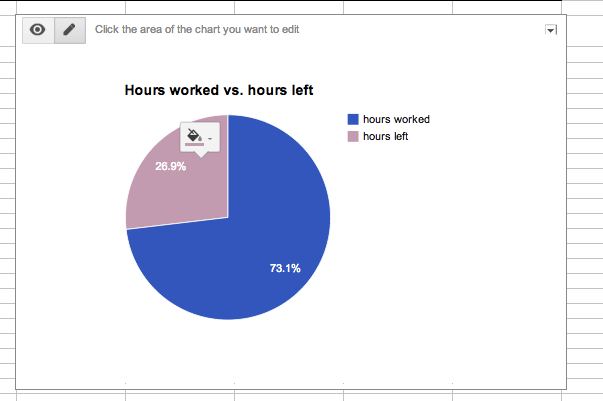
Click the Insert button. You can move the chart within your spreadsheet, add a title, change the colors and the font.
Then to distribute your spreadsheet, select Download as and then PDF document or share the file through Google Docs.
These examples really just scratch the surface of what spreadsheets can do for you. For example, heres an online discussion of how game designers map game play with spreadsheets.
I hope youll find spreadsheets useful for your design projects as well.
Article Slider image:

[h=2]Liked This? Read These![/h]
Graphics Asset Mgmt./Workflow
Photo Asset Mgmt./Workflow
Print Asset Mgmt./Workflow
More...
Susan Neuhaus
Rating:
0/5
Body:
Spreadsheets may seem like the exclusive domain of accountants and other number crunchers, but they can make life easier for designers too. Im using Google Drive spreadsheets in the examples below. You can create and store them for free with a Google account.
[h=2]Spreadsheets 101[/h] Before we dive in, lets review a few spreadsheet basics for absolute beginngers. When you open a spreadsheet, you see a grid of boxes that are called cells. Each cell contains a bit of information. The cells are arranged horizontally in rows which are numbered, and vertically in columns, which are indicated by letters. If youve ever worked on an HTML table or made a chart or graph you get the idea. Most spreadsheets can have multiple pages of these grids, called sheets The first row of a spreadsheet often has labels, and is then called the header row. A group of cells is called a range.
Each cell has an address made up of the column letter and the row number ie: G12. The cells can contain words or numbers in various styles such as time or date, currency, and percentage. Cells can also contain formulas. The formulas use numbers or the data in other cells to add, subtract, average and more. In a formula, a cell is referred to by its address, such as G12. These cell formulas are visible in the formula bar, at the top of the screen under the menu bar. The answer to the formula is visible in the cell.
[h=2]1. Tracking Little Details in Big Jobs[/h] Looking at information in different ways by sorting data is one handy thing spreadsheets can do. You can use this to track progress on jobs and reorganize the information for different purposes. Recently my studio had to create images for a fabric website. We had to add the product ID and one of 15 different ruler graphics to a 100 or so jpg images of fabric patterns. To accomplish this, we needed to know several things: which fabric belonged with which collection; which ruler graphic should be applied; how to find the cropping reference; and where each fabric pattern was in our workflow. So I set up a spreadsheet like this:
We decided it was more efficient to do all the 10 ruler images at once. So I sorted the spreadsheet like this:
Now the production artist could see a continuous list of all the images that needed a 10 ruler graphic.
I could easily sort the data by workflow stage (Lo Res recd) so I could quickly copy and paste a list of lo-res images that I still needed and send it to the project manager:
You sort the data in a spreadsheet by selecting all the cells you would like to sort, and selecting sort range from the data menu. Youll get a dialog box asking which column youd like to use to determine the sort, if the range you selected has a header row, and if youd like to sort from A to Z or Z to A. (Numbers will be sorted lowest to highest or vice versa).
Caution: Be careful when you select your data range for sorting! If, for example, you miss a couple of columns or rows when you select the range, your data could get out of order.
[h=1]2. Free Productivity-Boosting Forms[/h] You dont need to be an expert to use spreadsheets. Spreadsheet ninjas offer free pre-made spreadsheet templates for Google docs and Microsoft Excel. They range from personal finance calculators to calorie counters. There are useful ones for designers, including time tracking, web browser testing, and client forms.
When you see a form you like, select use this template.
Google will save it to a tab called Templates Ive Used so you can easily find it again when you search Google templates. You can also save a copy to your Google Drive.
You usually dont have to know how the formulas work to use them, although I find sometimes I need to make a fix. Spreadsheet formulas look different than the math I was taught in school, but its not rocket science.
1+1=2 would look like this in the formula bar:
=sum(1,1)
Youre instructing the cell to show you:
the answer(=) when you add (sum) one plus one (1,1)
Adding the contents of the cell at column B row 2 to the contents of the cell at column C row 2 would look like this in the formula bar:
=sum(B2,C2)
[h=1]3. Make Your Computer Figure it Out[/h] Spreadsheet formulas can do calculations for you, speeding up your work. For instance, when writing CSS for an ebook, I calculated percentages for a fluid multi-column div based on the pixel widths in the layout. Heres how I did it.
I made a place to input the numbers from the static layout in column B:
the width of the div in pixels (from the layout);
the number of columns;
and the gutter width in pixels (from the layout).
In C2, I put 100, because my whole div is 100%.
First, in cell C4, figure the widths of the gutters in percent by dividing the gutter width by the div width: =divide(B5,B3)
Then in cell E3, string several functions together by nesting them inside each other. Google spreadsheets will perform the inside functions first.
1. Figure out how many gutters there will be (The number of columns minus 1, or minus(B4,1))
2. Then multiply the number of gutters times the % width of the gutters,
3. Subtract the width of the gutters from the 100% and
4. Divide whats left by the number of columns to get the column width in percent.
Google also offers a good overview of adding formulas to spreadsheets.
[h=1]4. Keep Project Managers Happy with Pie (Charts)[/h] Spreadsheets can display data as charts and graphs, so for example, you could show hours spent on a job vs. the hours estimated.
Set up a spreadsheet with the parts of the job in rows, plus a header row with dates and total time spent. Include time remaining estimates if thats helpful.
To get a total of hours spent, select the range of cells in the hours worked column, (in this case, from row 4 to row 16) and choose sum from the functions fly-out menu.
Notice that the formula has a colon instead of a comma between the two cell addresses. That means that the function (sum, or addition, is to be done to all the cells from F4 to F16)
You do the same for the forecast of remaining hours column.
Now, subtract the hours spent from your estimate:
Put labels for your data in column A, rows 19 - 21
Put total estimate hours in cell B19
Put =(F17) in cell B20 to place your total hours worked there as well
Put this formula in cell 21B: =minus(B19,B20) to figure hours left
Select the range of cells from A20 diagonally across to B21. Choose Chart from the Insert menu. Choose pie chart from the dialog box.
Click the Insert button. You can move the chart within your spreadsheet, add a title, change the colors and the font.
Then to distribute your spreadsheet, select Download as and then PDF document or share the file through Google Docs.
These examples really just scratch the surface of what spreadsheets can do for you. For example, heres an online discussion of how game designers map game play with spreadsheets.
I hope youll find spreadsheets useful for your design projects as well.
Article Slider image:
[h=2]Liked This? Read These![/h]
| [h=3]Create Spreadsheets Inside InDesign CS4 & CS5[/h] Press Release DTP Tools' new Active Tables plug-in, now in public beta, brings spreadsheet-like functionality to InDesign. It allows you to sort tables and create formulas. Formulas are not... Read More | [h=3]Teacup Software Announces Sale of Table and Cell Styles Technology to Adobe[/h] Teacup Software, Inc., a leading provider of plugins for Adobe® InDesign® CS and InDesign CS2, today announced the sale of their TableStyles and CellStyles plug-ins to Adobe Systems Incorporated. ... Read More |
[h=3]How to Create Beautiful Tables: Controlling Row and Column Spacing[/h]  Setting tables isnt easy, but with these techniques, you can cut the task down to size. Read More | [h=3]Sidebar: Halftoning and Halftone Cells[/h] Halftones are nothing new, and in fact, have been in use since the late 1800's. Traditionally, halftones were created via a photomechanical process, which is still sometimes used today: Light passes... Read More |
Graphics Asset Mgmt./Workflow
Photo Asset Mgmt./Workflow
Print Asset Mgmt./Workflow
More...